Platform
SUI Price Holds Strong at $2, Eyes Breakout Toward $3
Sponsored
SUI price holds steady above $2 with signs of a bullish breakout. Explore key technical insights, Fibonacci levels, and market sentiment.
The SUI price is displaying resilience in the face of a broader bearish trend, holding firm above the $2 psychological support zone. On the daily chart, the SUI token is trading within a descending wedge pattern, which often precedes a breakout phase. This structure has captured the attention of traders and analysts alike, especially as SUI approaches the apex of the wedge, where volatility tends to spike and price direction becomes decisive.
Since peaking earlier in the year, the SUI token has retraced nearly 60%, reflecting a steep correction that aligns with macro-level market softness. Within this declining pattern, the price action has shown consistent lower highs and lower lows, but the consolidation above $2 offers a glimmer of hope for bullish traders. This support has held even after a series of four consecutive bearish candles led to a 12.43% drop in value, signaling potential exhaustion among sellers.
Fibonacci Levels Reveal Strategic Zones for SUI Price Action
Technical indicators, particularly the Fibonacci retracement levels, are playing a pivotal role in identifying potential reversal zones for the SUI price. The token has fallen below the critical 38.20% Fibonacci level at $2.20, a bearish signal that further confirmed a downtrend in January. This breach was accompanied by a breakdown below the bullish line of the Super Trend Indicator, turning the tide in favor of sellers.
Currently, the bearish Super Trend line rests at $2.6593. To reignite a strong upward momentum, SUI would need to decisively break above the $2.65 resistance, reclaiming the lost bullish ground. On the upside, reclaiming the 23.60% Fibonacci level at $3.00 would validate a trend reversal, with further targets at $3.50 and beyond.
On the downside, the 50% Fibonacci level at $1.68 serves as the most critical support. A breakdown below this would open the door for further losses, possibly retesting the $1.50 zone. However, the current technical setup suggests that buyers are preparing to regain control.
RSI Indicator Hints at Bullish Reversal Potential
Momentum indicators are beginning to signal a shift in trader sentiment. The Relative Strength Index (RSI) on the daily chart has bounced off levels close to the oversold threshold and is now gravitating toward the midpoint. This movement hints at a potential bullish divergence, a common precursor to price reversals in consolidating markets.
A sustained move of the RSI above 50 would bolster the case for a bullish breakout, especially as the price edges closer to the wedge pattern’s apex. The next few daily candles will be crucial—either confirming a bullish rally or exposing the token to another wave of selling pressure. Intraday buyers have already made a statement with a modest 2% recovery, setting the stage for a possible breakout challenge.
Strategic Partnership in Greece Fuels Optimism for SUI
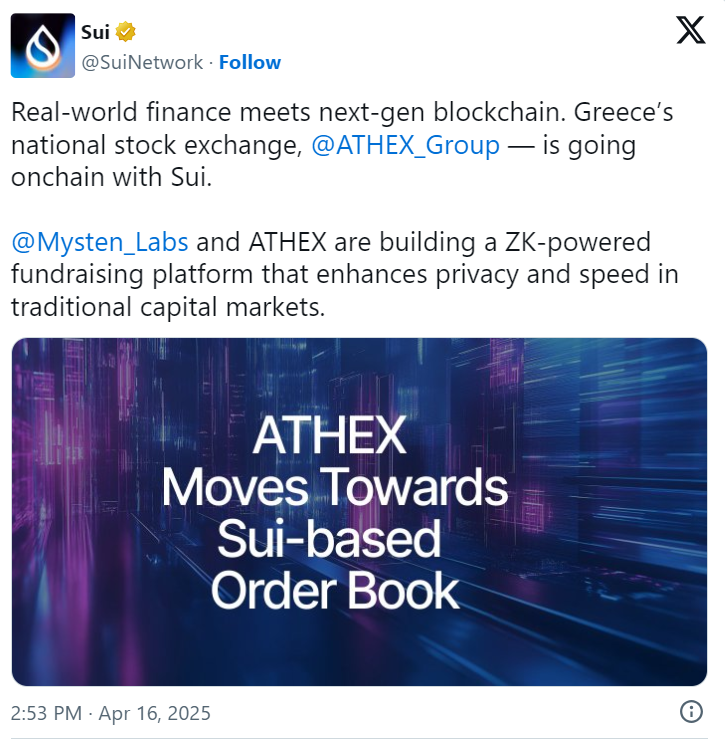
Beyond technical indicators, fundamental news is also working in favor of SUI. In a major development, the National Stock Exchange of Greece has announced a partnership with the SUI blockchain to develop a fully on-chain fundraising platform. This alliance is a monumental milestone for the SUI ecosystem, strengthening its use case in traditional financial markets.
The partnership underlines growing institutional confidence in the SUI blockchain’s capabilities, especially its speed, scalability, and smart contract infrastructure. This move could pave the way for similar integrations with other financial institutions across Europe and beyond, further enhancing SUI’s network value and market demand.
Stablecoin Supply Surge Shows Growing Network Demand
Adding to the bullish narrative is the explosive growth in SUI's stablecoin supply, which has recently hit an all-time high. A tweet by analyst Torero Romero highlighted that the SUI stablecoin supply has surged to $746.81 million, reflecting a 99.82% increase year-to-date. This remarkable rise points to heightened liquidity within the SUI ecosystem—an essential metric for assessing the health and adoption of a blockchain network.
High liquidity often translates to lower slippage, better trading efficiency, and increased user participation in DeFi activities. As more users interact with SUI-based dApps and protocols, network activity is likely to surge, boosting demand for the native token and contributing to long-term price appreciation.
Analysts Predict a 560% Upside Potential in SUI Price
The technical case for a breakout is also gaining traction among crypto analysts. One notable voice, CryptoWZRD, has drawn parallels between the current SUI price structure and historic Bitcoin falling wedge breakouts. According to his analysis, if SUI follows the same trajectory as BTC in past cycles, it could rally over 560%, targeting the $5 level.

This bullish projection hinges on a clean breakout above $2.90, which would invalidate the current bearish structure and shift market momentum decisively in favor of bulls. While this remains speculative, the increasing number of technical confluences, combined with growing network fundamentals, make this a scenario worth watching closely.
What to Expect Next for SUI Token Price
As the SUI price trades within striking distance of a pivotal breakout point, the market is waiting for a decisive move. If the token successfully breaks above the overhead trendline and surpasses the $2.65 and $2.90 resistance levels, traders can expect an accelerated push toward the $3.00 psychological barrier. Further bullish confirmation could open the path to $4.50 and even $5.00.
Conversely, failure to break out could see the token retest lower support zones, starting at $1.90 and possibly as low as $1.68. Market participants should closely monitor volume spikes, RSI movement, and candlestick patterns over the coming sessions.
SUI is currently one of the most closely watched altcoins in the market, not just due to its price action but also because of the robust ecosystem developments fueling its long-term growth. For traders and investors, the current consolidation phase offers both risks and rewards—making it a pivotal moment in the token’s journey.
❓ Frequently Asked Questions (FAQs)
1. What is driving the recent price stability in SUI?
The SUI token is holding above the $2 support due to a combination of technical consolidation within a wedge pattern and bullish fundamental developments, including a strategic partnership in Greece.
2. What are the key resistance levels for SUI?
Important resistance levels to watch are $2.20 (38.2% Fibonacci), $2.65 (Super Trend), $2.90 (breakout level), and $3.00 (23.6% Fibonacci and psychological barrier).
3. Is now a good time to invest in SUI?
While SUI shows signs of an upcoming breakout, all investments carry risk. Consider technical indicators, fundamental news, and market sentiment before investing. Always conduct your own research.
4. What does the Greece partnership mean for SUI?
The partnership with Greece’s National Stock Exchange to build an on-chain fundraising platform showcases institutional trust in SUI's blockchain capabilities, potentially expanding its adoption in traditional finance.
5. Could SUI reach $5?
Some analysts predict a breakout rally could send SUI toward $5, especially if it mirrors previous wedge breakout patterns seen in Bitcoin. However, this depends on breaking multiple resistance zones.
Recommended for you